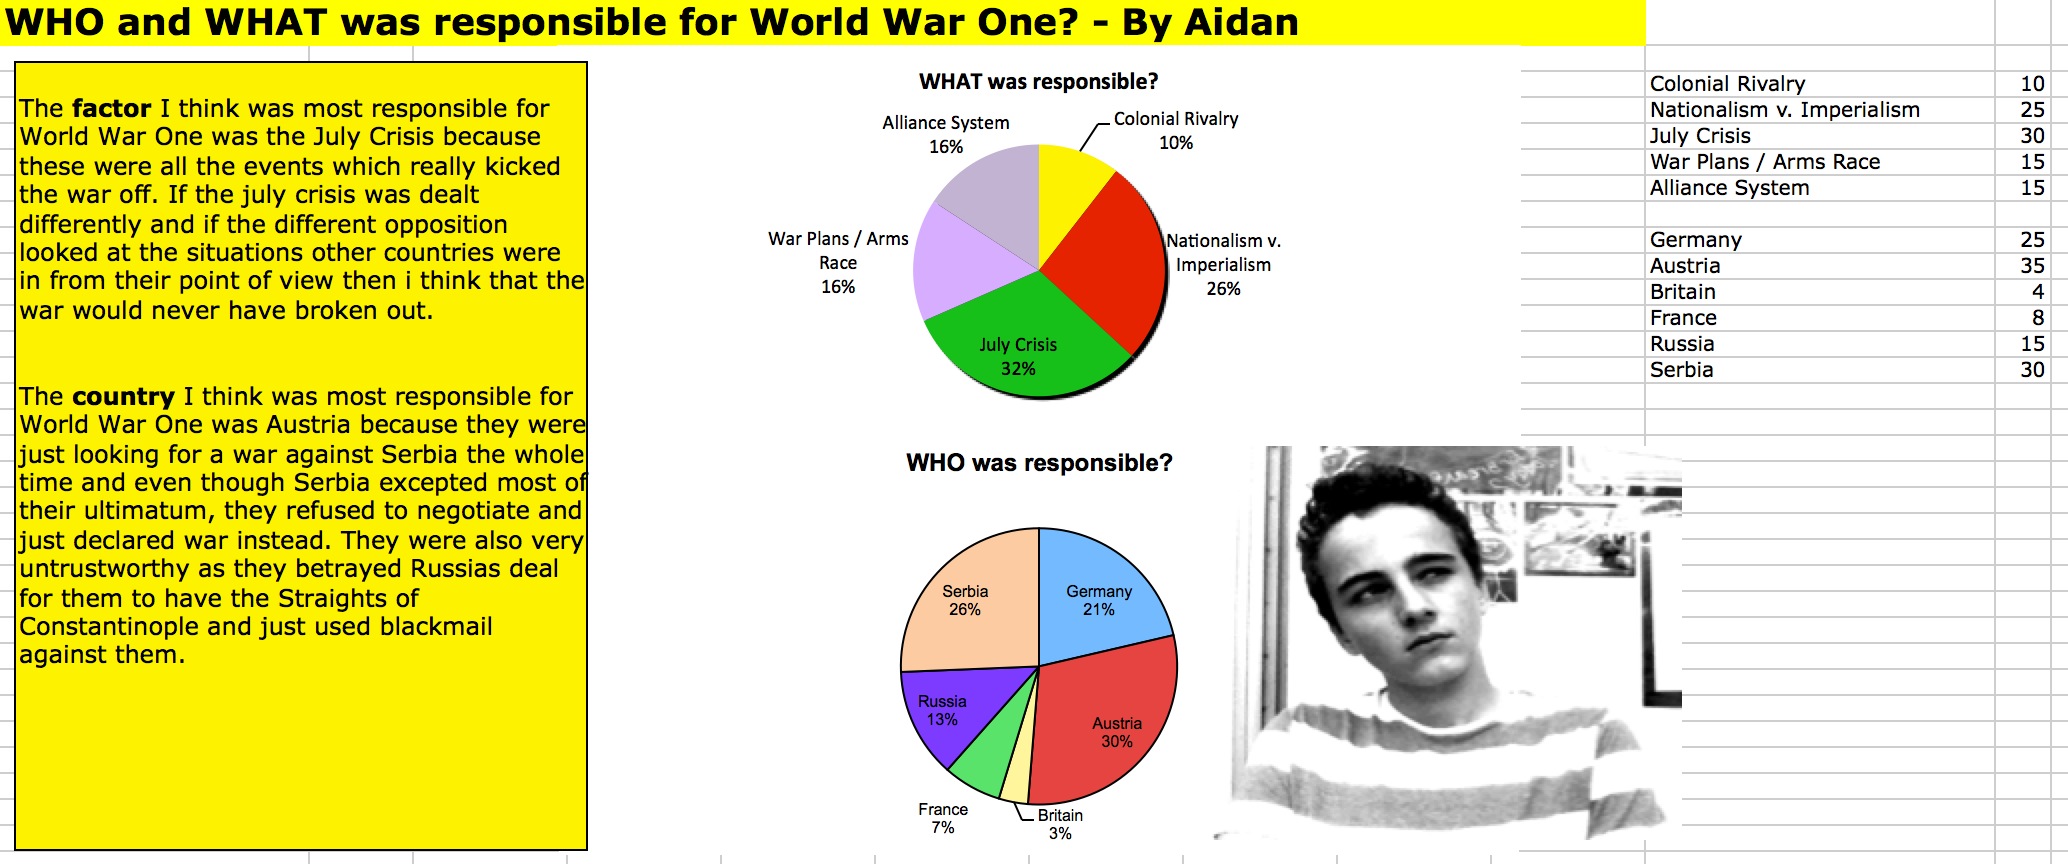
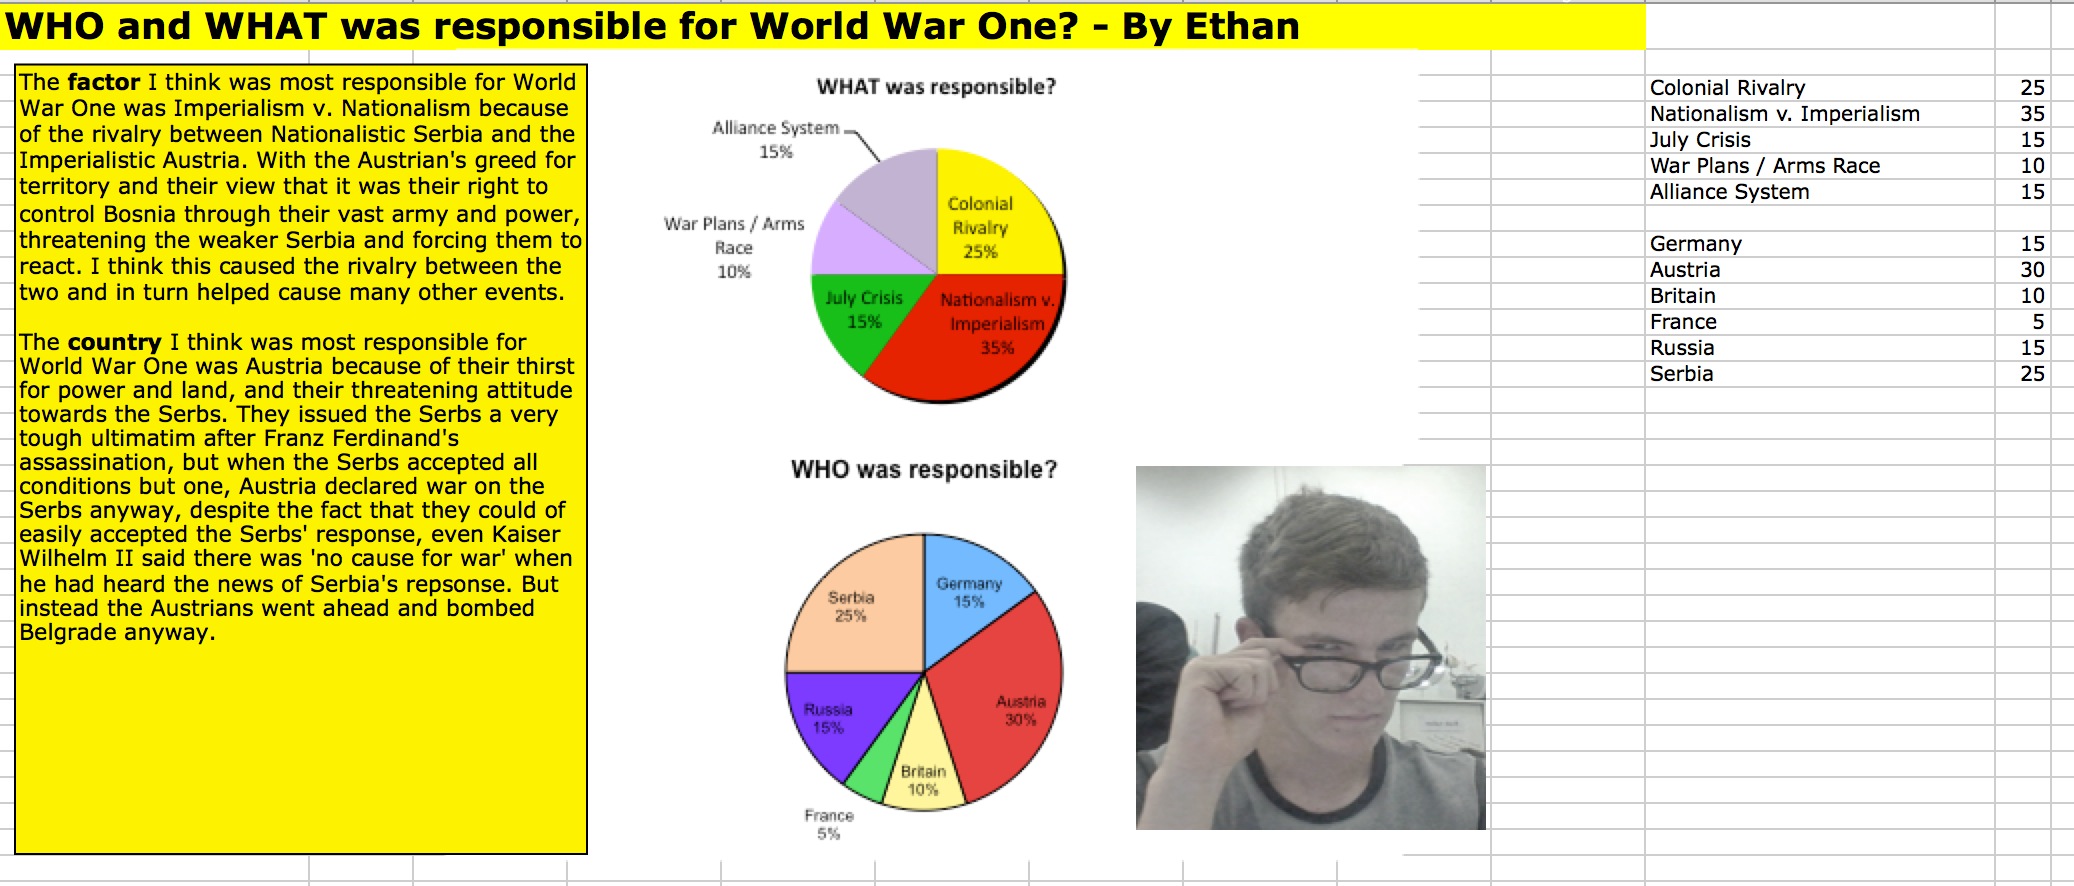
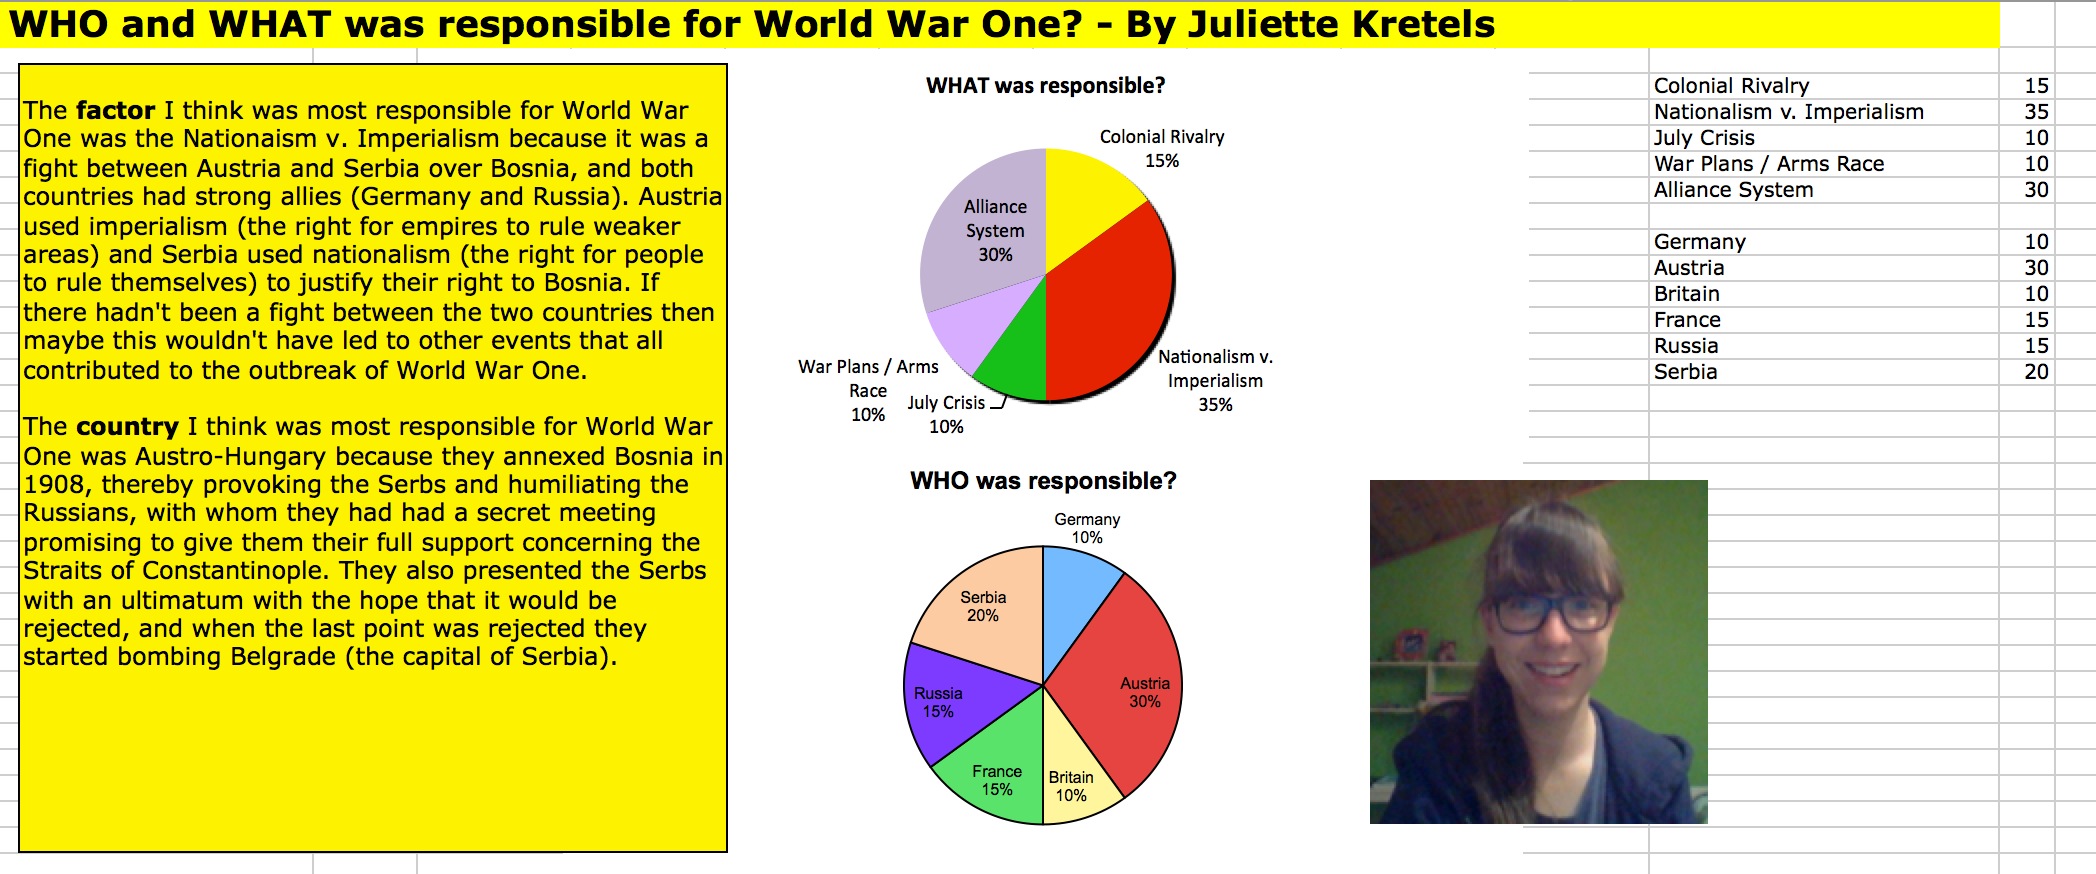
At the end of a unit of study about causation, ask students to divide responsibility between factors in an Excel template which automatically converts the percentage splits into piecharts; thereafter they have to explain their reasoning.
Here’s an example where students had to reflect upon WHO and WHAT was most responsible for the First World War (part of their homework task, as you might guess, was to take a suitably cheesy “historian’s selfie”!). It forms the basis of a great piece of display work.


Downloads
Excel spreadsheet: Who and What was Responsible for World War One?